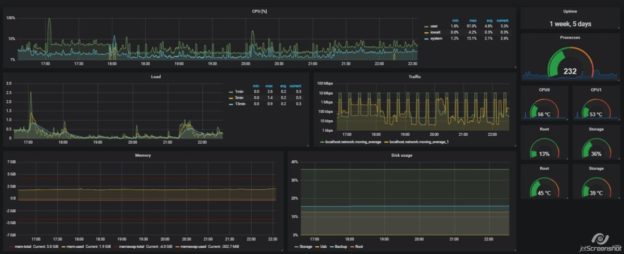
Library stack
- Grafana v5.3.2
- Glances v3.0.2
- InfluxDb v1.0.2
Install & conf Glances 3.0
Install Glances from PIP:
sudo apt-get install python python-pip python-dev influxdb-client
sudo pip install glances influxdb
If you need additional support for your services you have to install optional dependencies. In my case I also installed docker, hddtemp
sudo pip install docker hddtempLogin into InfluxDB and create database:
influx -username LOGIN -password PASSCREATE DATABASE glances
CREATE RETENTION POLICY "one_year_only" ON "glances" DURATION 365d REPLICATION 1 DEFAULTCreate configuration file for glances:
nano /usr/src/glances.conf[influxdb]
host=127.0.0.1
port=8086
user=USER
password=PASSWORD
db=glances
prefix=localhostCreate systemd service
Add glances to Systemd as new service. Create new file and copy/past example (source):
sudo nano /etc/systemd/system/glances.service[Unit]
Description=Glances
After=network.target
[Service]
ExecStart=/usr/local/bin/glances --quiet -t 15 --export influxdb -C /usr/src/glances.conf
Restart=on-failure
RestartSec=30s
TimeoutSec=30s
[Install]
WantedBy=multi-user.targetParameter -t says how often data will be refreshed. Default is 3s. I changed it, because 3s resolution is useless.
sudo systemctl enable glances.service
sudo systemctl start glances.service
After few second we can see new data stored in InfluxDB
> use glances
Using database glances
> show series
key
localhost.cpu
localhost.diskio
localhost.docker
localhost.fs
localhost.ip
localhost.load
localhost.mem
localhost.memswap
localhost.network
localhost.percpu
localhost.processcount
localhost.sensors
localhost.system
localhost.uptime
Grafana config
Create data source
Import dashboard
You can import predefined dashboard from community or prepare yours own.
